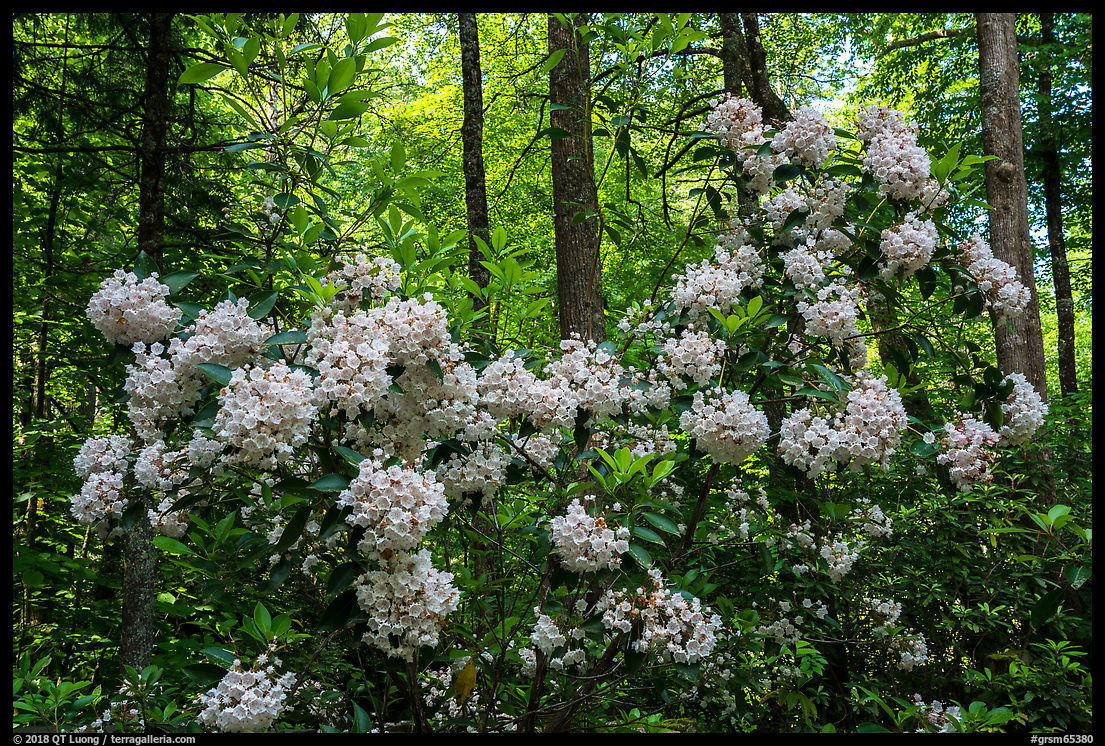
One of nature’s most wondrous light shows occurs during the synchronous fireflies mating season, when the bugs flash at once in a silent symphony of sparks. Synchronous fireflies exist only in a handful of places in the world, with Great Smoky Mountains National Park being the most well known. In this article, I explain how you can view the awesome event and provide detailed tips for photographing the fireflies, an endeavor that is sure to challenge your skills.
What are synchronous fireflies and how rare are they?
If unlike me, you have lived on the U.S. East Coast, you might have seen twinkling fireflies in your backyard. Now imagine the magic of seeing them flashing at once. Upon transforming from larvea into adult insects, male fireflies stop eating for the three weeks of their remaining lives. Given that short time left to attract a partner, they blink in order to court females. There are many species of fireflies that live in Great Smoky Mountains National Park, but only one, the Synchronous fireflies (Photinus carolinus) can synchronize their flashing, for reason that are still mysterious. In
Fireflies, Glow-worms and Lightning Bugs, researcher Lynn Frierson Faust writes:
dense populations of fireflies are more likely to synchronize in order for the females to be able to answer the male flash (during the dark interval) and still be seen… we found that Photinus carolinous females will refuse to respond if multiple male flash patterns are presented to them randomly
The whole forest becomes similar to a giant Christmas tree, with thousands of flying fireflies flashing about six times in unison, and then going totally dark for about six seconds, and repeating again for about two hours.

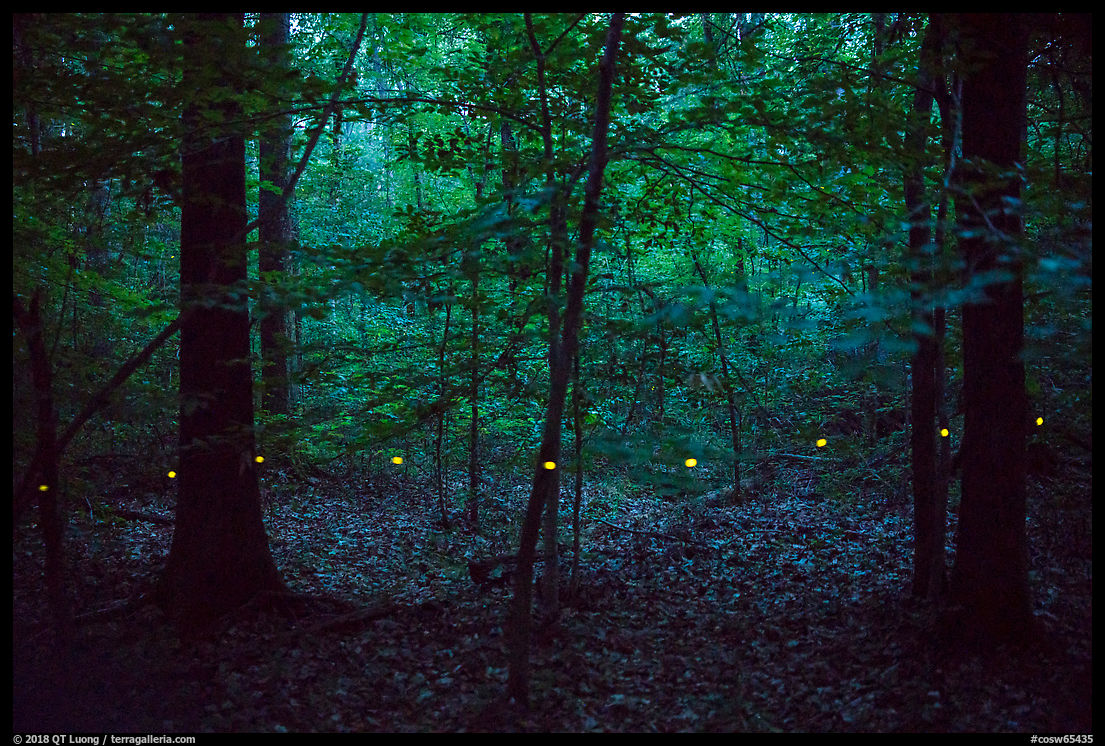
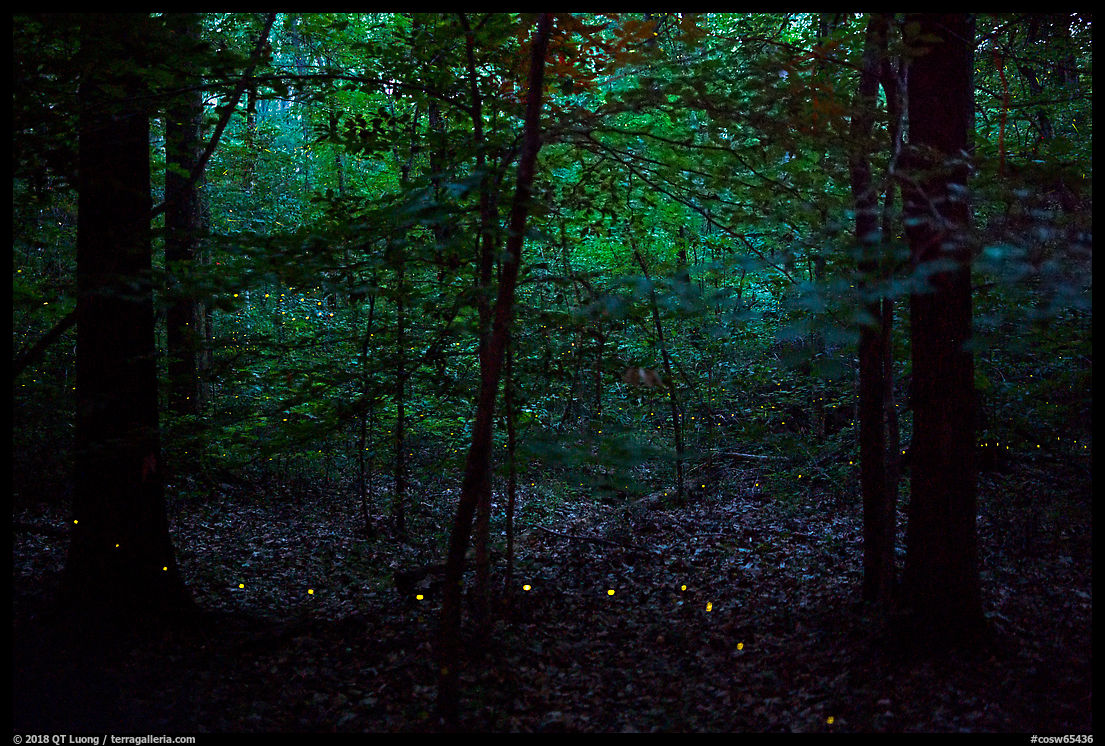
9:46 PM. Sony A7R2, Rokinon 35mm f1.4 lens. 4.5 min at f/2.8, ISO 1600. +1.3 Exposure in LR
To see the firefly light show, you have to be at the right place at the right time, and that’s only a few dozen hours per year in a handful of places in the world. The Smokies display takes place only during two weeks each year, with the peak date changing impredictably from year to year, anytime from the third week of May to the third week in June. It doesn’t last all night, but only for about two hours, from 9:30pm to 11:30pm, with the most active time being the middle of this window. The images in this article are roughly arranged by time of the night. Compare the amount of fireflies in the first (9:46) and last (10:35) images – keeping in mind that the exposure time was doubled. Fireflies will not fly if it rains. If it is too damp or too cold, they will not flash. Moreover, while fireflies can be seen all over Great Smoky Mountains National Park, which is home to 19 species of which 13 flash, synchronous fireflies are found in large numbers only around the Little River Valley near Elkmont, a forming logging village and now campground, which boasts the largest population of synchronous fireflies in the Western Hemisphere. Only Southeast Asian mangrove forests have displays that rival that.
Logistics
With increasing numbers vying to witness this unique phenomenon, the
NPS had to put in place strict rules and quotas, which have been evolving since 2006. Tickets sold out in minutes, so in 2017, the park began a lottery system. In 2018, the restricted period, coinciding with the mating season peak, was from June 7 to June 14 and 21,000 entered the lottery for one out 1,800 passes. Winning the one in ten odds let you park a car at the Sugarlands Visitor
Center and board a shuttle for Elkmont. During the restricted period, from 4pm to 11pm, the NPS closes the Elkmont road except for shuttles and registered campers. The Elkmont Campground usually fills up two months in advance, but a few spots sometimes open due to cancellations.

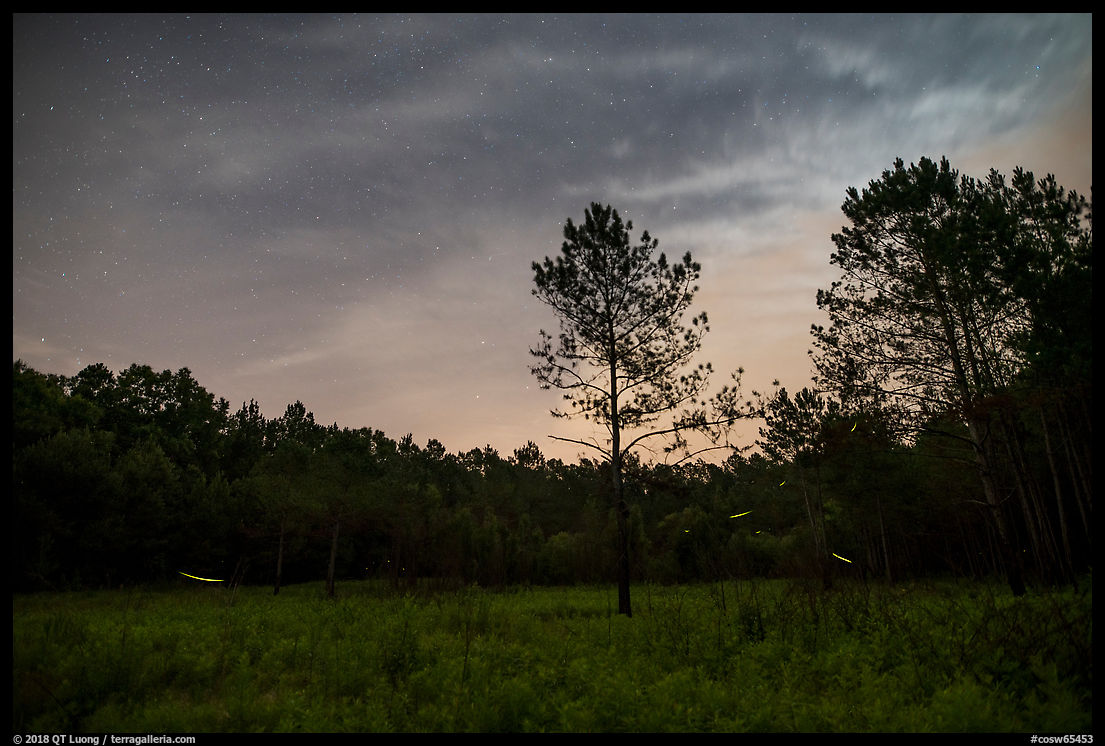
9:42 PM. Sony A7R2, Sigma 20mm f1.4 lens. 30s at f/1.4, ISO 1600. +3.6 Exposure in LR
During the restricted period, almost a thousand people are expected each night in Elkmont. For more quiet, you can instead visit a few days before or a few days after the restricted period, or get a designated backcountry campsite. Note that a backcountry permit does not allow you to enter Elkmont during restricted times.
Etiquette
Flashlights, and in particular white light disrupt the fireflies. To protect them, you should absolutely use a red light. It also helps preserve your night vision – and that of people around you, a common courtesy. Many headlamps come equipped with one, and are standard equipment for night photographers.
Otherwise, you can cover your light with red cellophane, provided at the Elkmont Campground and during official viewing sessions. Even a red light is quite bright in pitch darkness, and there is scientific evidence that it interferes with fireflies breeding, so minimize the disturbance by using it only when strictly necessary while walking, and by pointing it at the ground. Once you are at your spot, do not turn on your light.
You should obviously not use flash. When operating your camera, be sure to turn off or cover your LCD, which is also very bright in the dark. If you need to access your bag for gear, be sure to be able to do so without seeing anything so that you don’t have to turn on your light. Despite the official recommendations from the NPS, within a crowd, it is very likely that someone will shine a light and ruin the long exposures required to photograph the fireflies. It doesn’t take much when you are using high ISO. I noticed that the camera red light that flashes while the self-timer is activated was enough to impact the exposure of my second camera.
Locations
The most popular viewing area is along the wide Little River Trail, at the beginning of which many brought lawn chairs.
On June 5, I hiked a mile on the Little River Trail and that was enough to not have anybody else around. The bugs fly about 2-6 feet from the forest floor, but the steepness of the hill on the south side of the trail spread them all over the frame.

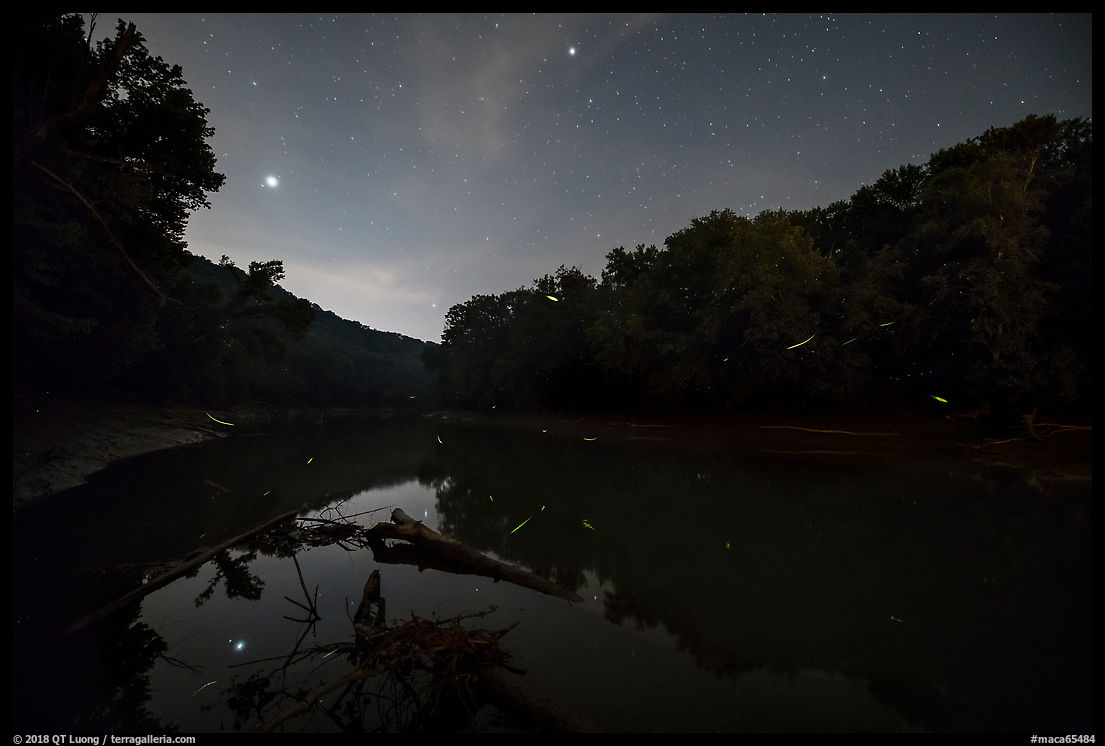
Digital composite. Sony A7R2, Sigma 20mm f1.4 lens. Base exposure: 30s at f/2.2, ISO 200. Fireflies: 28 frames, 30s at f/1.4, ISO 3200
Because the shuttles disgorge visitors at the Little River Trailhead, and the Little River Trail is the official viewing area where rangers and volunteers direct visitors, during the restricted period, several hundreds will be found there. To avoid them, I followed the Jakes Creek Trail on subsequent nights. On June 6, less than a mile from the trailhead, I had the place to myself again, but on June 7, returning to a previously scouted spot, I had to share it with two photographers, who fortunately were disciplined and considerate.
Photography equipment
Viewing the fireflies is an awesome experience, but most visitors will have only memories of the event. This is one situation where a camera phone will not capture anything.

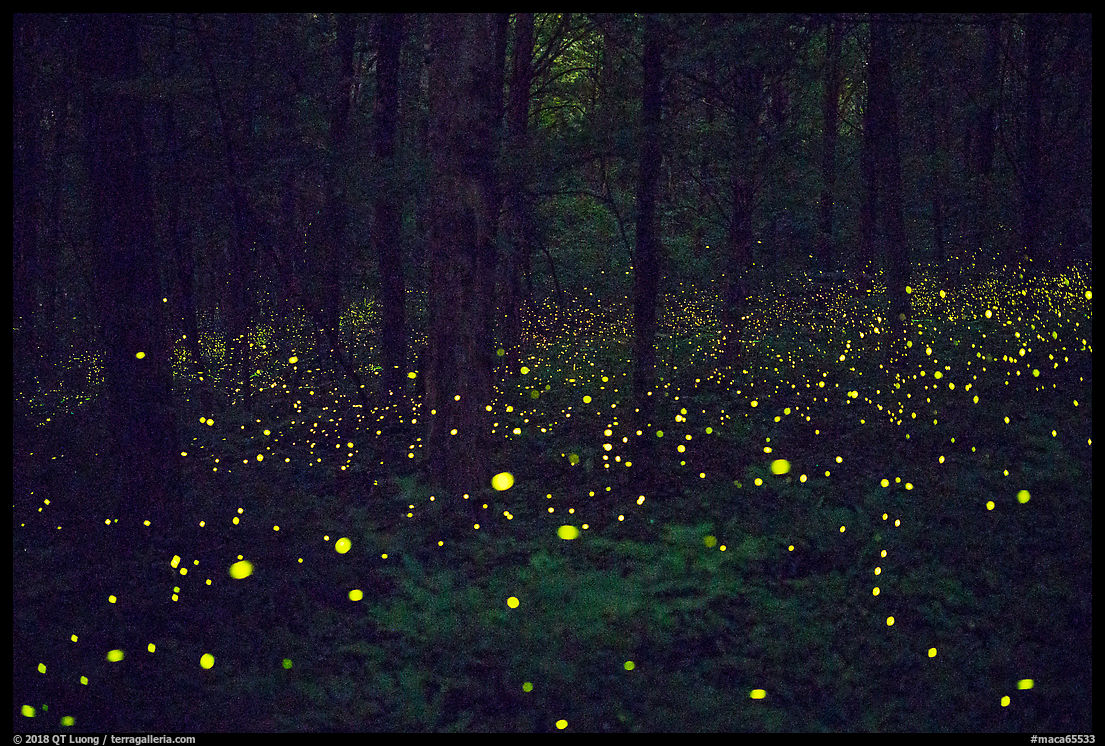
10:21 PM. Sony A7R2, Rokinon 35mm f1.4 lens. 11 min at f/1.4, ISO 1600. +2 Exposure in LR
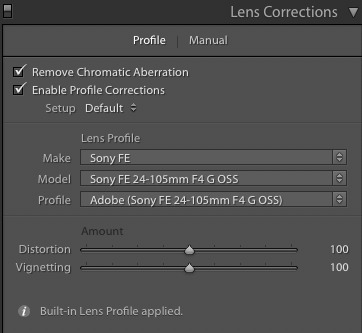
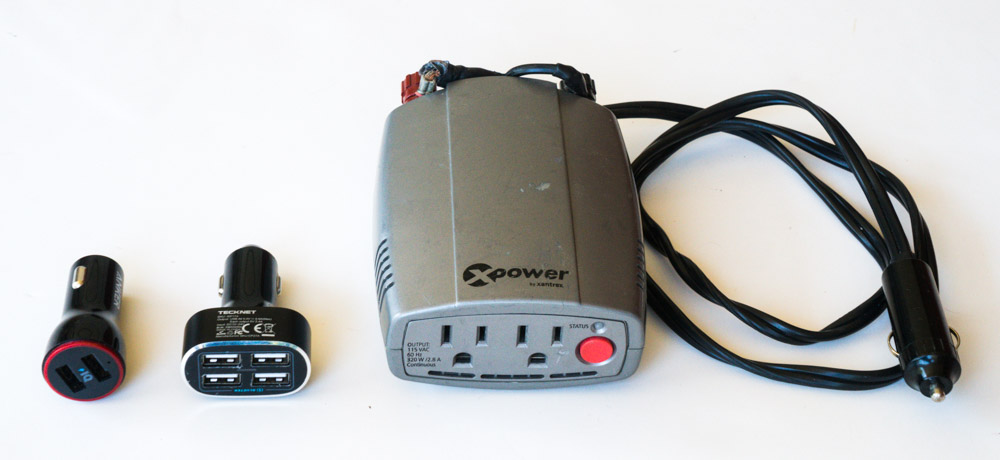
It goes without saying that you need a tripod. Any camera suitable for photographing the night sky can work, but the ability to use high ISO and long exposures with little noise is needed for single-frame captures. Specialized equipment will extend your window of opportunity and provide better results. Although in the dark the bugs look quite bright to your eye, they are actually fairly faint, so a fast lens is helpful because you need enough sensitivity to record the individual flashes of the bugs. The best choice is probably a 35mm f/1.4. Unless you are at the bottom of a steep hill, a wider lens (such as the 20mm f/1.4 that I used on my secondary camera) will include portions of the sky between treetops, which create bright spots that could be distracting. The depth of field of a 50mm f/1.4 is just too small. Unless compositing, exposures way longer than 30 seconds are needed to capture many bugs, light trails, and the forest, so you will need an accessory to lock your shutter for a bulb exposure.
Photography technique
Focussing can be quite the challenge because it is dark in the woods and you absolutely don’t want to shine a light. That is compounded by the shallow depth of field of your fast lens, which will not let you have everything in focus. Focussing at infinity or at a closer distance such as the closest trees produce different effects, but after trying both I found the former to generate a better sense of depth. I recommend to try and focus before it gets too dark, and then photograph for the rest of the evening with that focus setting. A tip of Sony users: the focus ring like is just an electronically coupled actuator, so taping it isn’t useful. If you happen to change a battery, the lens will reset its focusing point, so it is essential to start the evening with a full battery if you don’t want to loose your pre-set focus.

10:30 PM. Sony A7R2, Rokinon 45mm f1.4 lens. 27 min at f/1.4, ISO 3200. +0.7 Exposure in LR
To capture the forest and many fireflies, there are two approaches to exposure. The first one consists of making a single, very long exposure. Besides its purity, it has the advantage of working at any time of the night, with settings in the range of 8-30 min, ISO 1600-3200, f/1.4. The drawback is that long exposure (dark frame) noise reduction will need to be turned on, which will render your camera inoperable for double the exposure time, and even though the camera noise might still be excessive. The second approach is to make a low ISO base exposure of the forest while there is still some light, then keep your camera in place, make several exposures for the bugs, and blend them all. This approach is safer, but you will be hard pressed to make more than one such composite per night.
I have included the camera technical data and start of exposure time, but that alone would be misleading. More often than not, I didn’t come up with the optimal exposure and ended up I brightening considerably the frame in Lightroom – something that is possible with the Sony sensors even at high ISO with noise cleaning quite well in LR. I’ve therefore provided the LR exposure compensation so that you are armed with all the information you need. For reference, on June 7, sunset time was 8:48 PM.
My best tip for photography
The core of the photograph is a forest scene, and no amount of bugs would save a poor
composition. I would prefer to get the composition nailed before it gets too
dark to see anything. But before it gets dark enough, I cannot know if
many fireflies will be active within the composition. Activity varies
wildly even within a small area. On the second night, I composed a
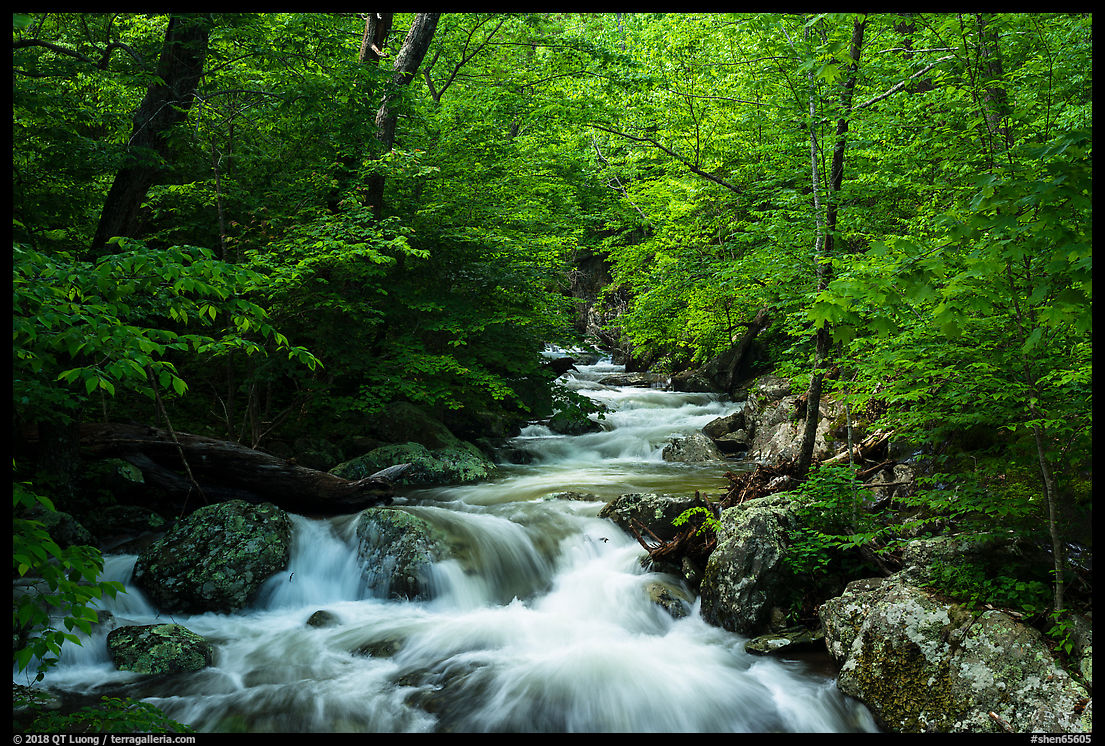
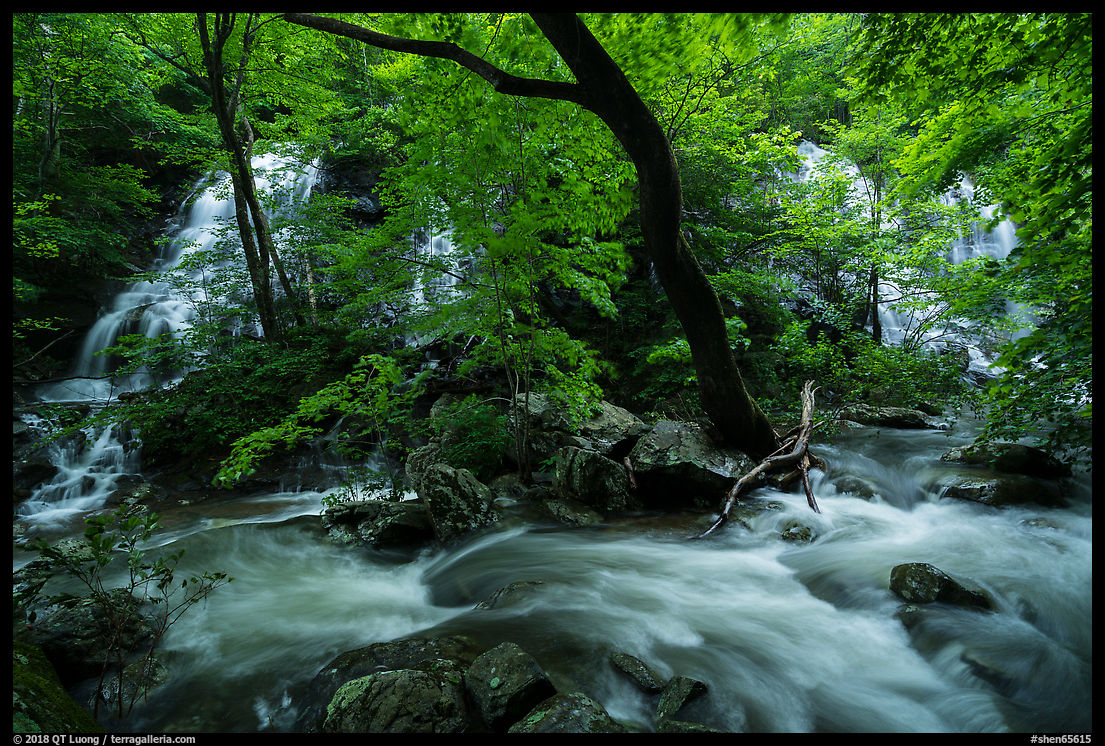
scene with a stream, since I feel they constitute the essence of the Smokies, and waited.
However, by 9:45 pm, not a single firefly had lit the area. I realized that it was a low activity spot – from what I have seen, fireflies don’t seem to frequent riverbanks too much. In a hurry, I looked for a spot with activity and since by then it was too dark to see, I used 6-figure ISO exposures to compose by trial and error. This resulted in the two previous images (10:21 and 10:30).

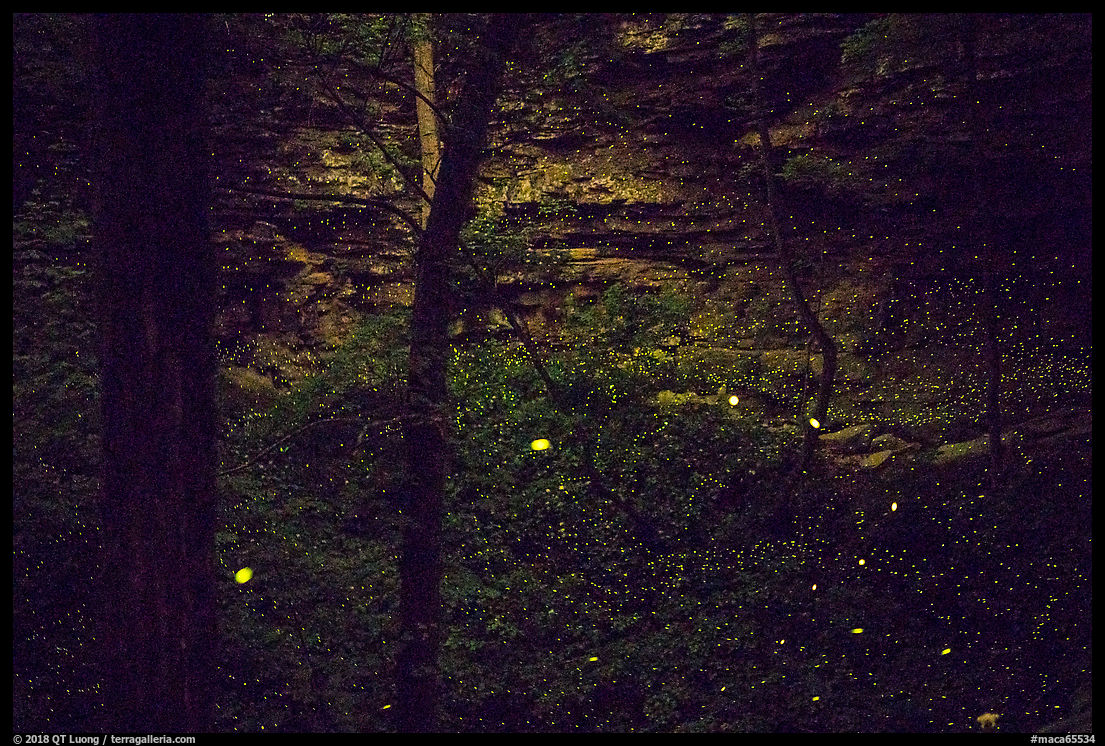
10:35 PM. Sony A7R2, Rokinon 35mm f1.4 lens. 11 min at f/1.4, ISO 1600. +1.8 Exposure in LR
Fortunately, I learned that the active spots are consistent night after night because activity depends on conditions such as soil composition and plant cover that do not change. Knowing that, after scouting on a previous night for the most active spots as I walked down the trial, I was able to come and set up a pre-dark composition which I knew would have plenty of bugs in it. Even a 30s exposure (9:42) captured quite a few.
By the time activity was in full swing, a relatively short exposure of 11 minutes was enough to fill up the frame with lights.
Part 1 of 3: 1
|
2
|
3