I wish everyone a year 2016 full of happiness, health, success and inspiration. My sincere thanks for your continuing readership and interest in my photography.
In 2015, the goal of my travels was to fill up the last “holes” in my comprehensive coverage of the National Parks, in preparation for the publication of my big book. This meant no new techniques, no planned foreign trips, and less photography outside of the parks than usual. I found myself again spending more time on and in water than usual: traveling to islands, snorkeling and scuba diving, wading in swamps and swimming in canyons. Even the land excursions often led me to the edge of water. I suppose that’s because as this landlubber wraps up the National Parks project, the watery environments naturally turned out to be the last visited because they push more the comfort zone. So continuing last year’s theme, for this review of 2015 I have selected only water-related images – with one exception.
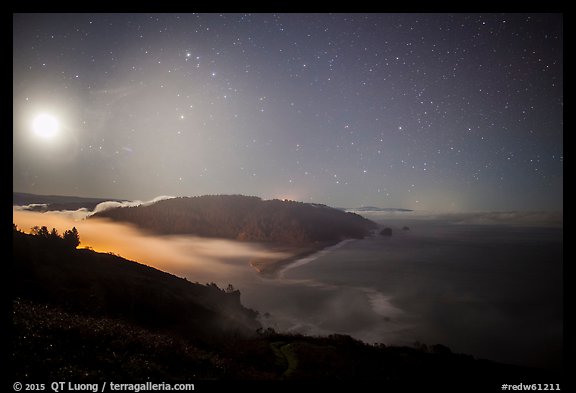
Mouth of Klamath River and moon at night. Redwood National Park
In January, besides hiking in
Jedediah Smith Redwoods, I also explored the somehow overlooked
coastal part of Redwood National Park, only one of two US National Parks where you can drive to the edge of the Pacific Ocean.
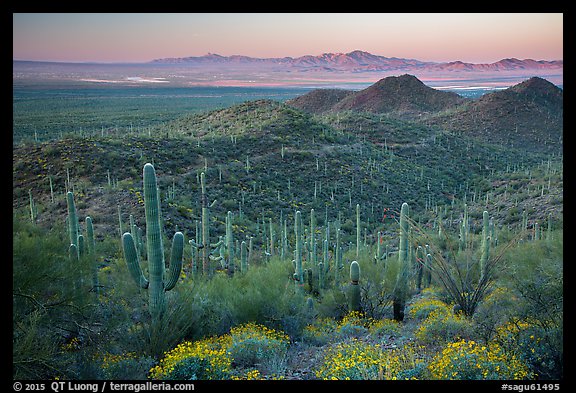
Saguaro cactus forest and Red Hills at sunrise. Saguaro National Park
In March, I spent five days (and $314) in Saguaro National Park. The main goal was to venture in the wild Rincon Mountains, which are seldom visited, although they occupy most of the land surface of the park. Although the Sonoran is the lushest of the five North American deserts, this was the only trip of the year that didn’t involve any kind of water.
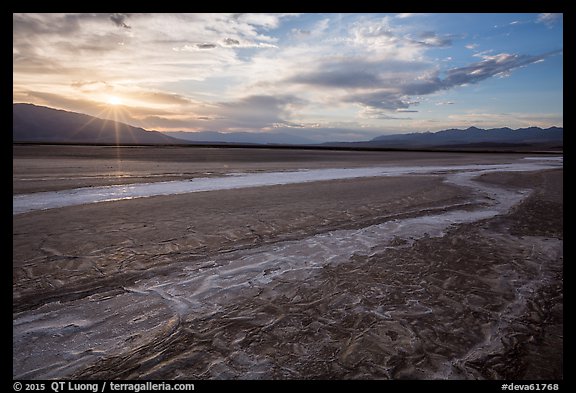
Rivers of salt and sunset, Cottonball Basin. Death Valley National Park
In April, I was back in the desert, this time in Death Valley National Park, checking out remote dunes that were new to me. Although conditions were too dry, I did find a relatively wet area with salt formations. I couldn’t guess that in the fall, Manly Lake would reappear again!
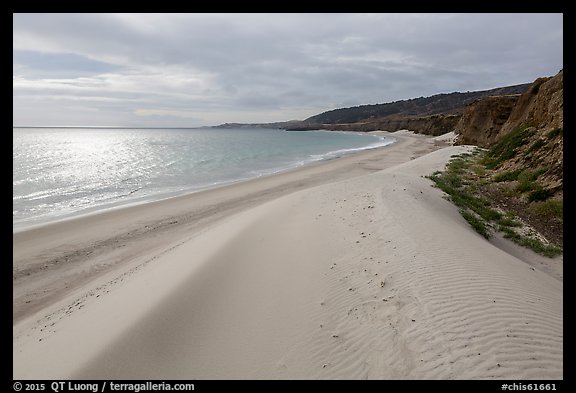
Dunes and sunlight, Water Canyon Beach, Santa Rosa Island. Channel Islands National Park
For an awesome contrast, on the same trip, I subsequently boarded the concessionaire boat to Santa Rosa Island, part of the cool marine environment of Channel Islands National Park.
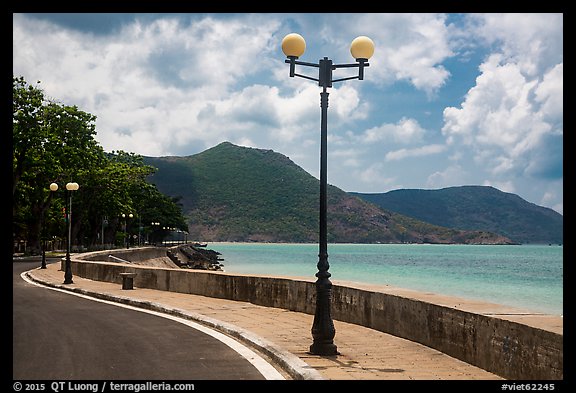
Seafront promenade, Con Son. Con Dao Islands, Vietnam
In May, my family and I traveled to Vietnam to attend my mother’s funeral. Afterwards, we visited the Con Dao Islands, possibly the last unspoiled coastal destination in Vietnam.
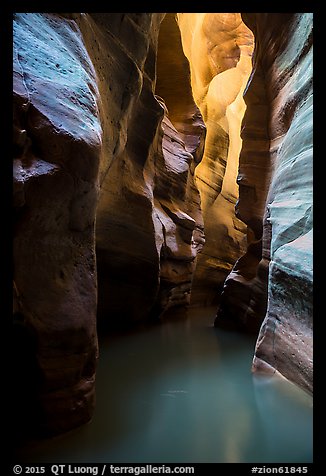
Flooded slot canyon. Zion National Park
In June, I spent a week in Zion to explore hidden canyons by canyoneering, a combination of hiking, climbing techniques, and swimming. Although each of the canyons offered a different experience, the highlight was hauntingly beautiful and subterranean Pine Creek Canyon, with an incredibly lucky find.
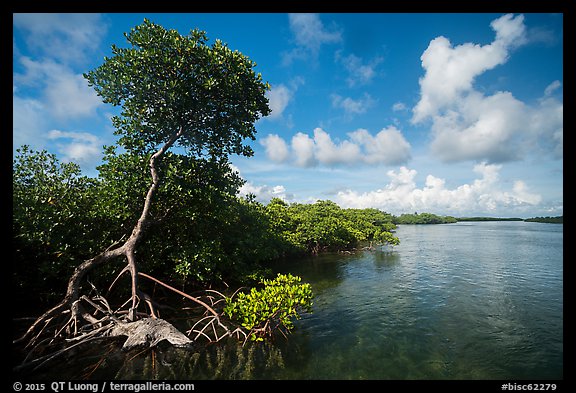
Tall mangrove tree and channel, Swan Key. Biscayne National Park
After a forced rest during the summer, in September I was back on the water to visit on a private boat the parts of Biscayne National Park that had eluded me before due to lack of transportation.
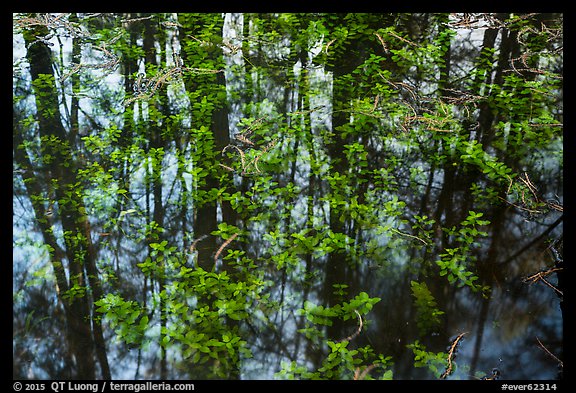
Bacopa and cypress dome reflection. Everglades National Park
On that trip, I couldn’t resist visiting the Everglades in summer for a third year in a row, even camping at Flamingo amidst the clouds of mosquitoes. I made this image while wading knee deep under the canopy of a cypress dome, while trying to keep an eye out for the resident alligator.
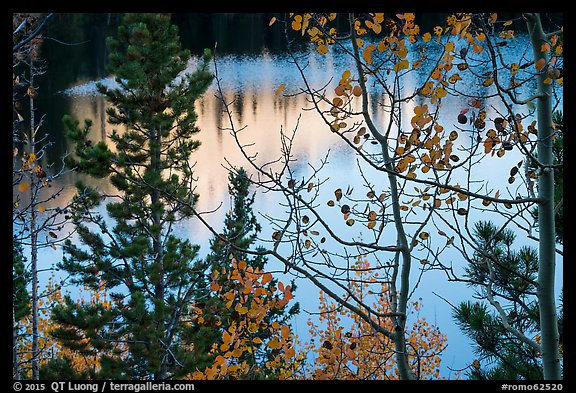
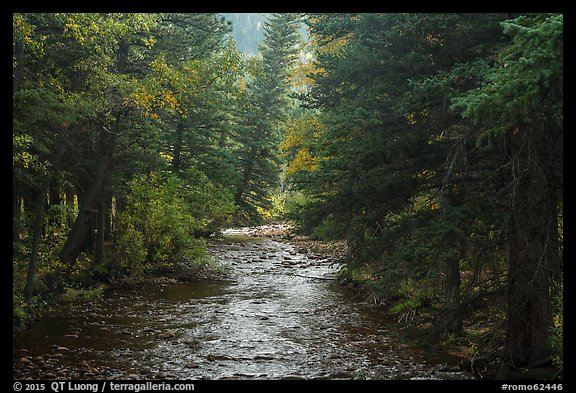
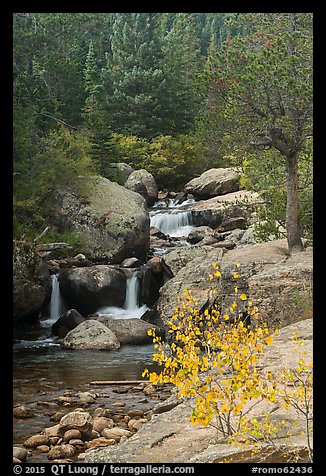
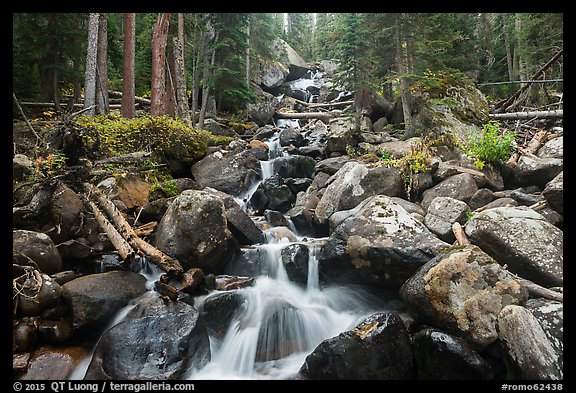
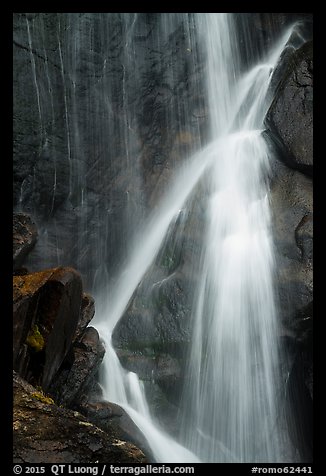
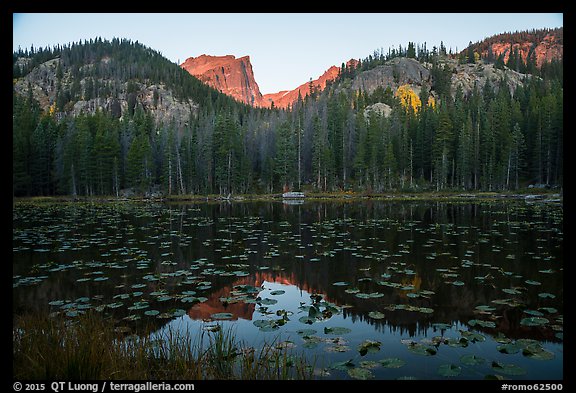
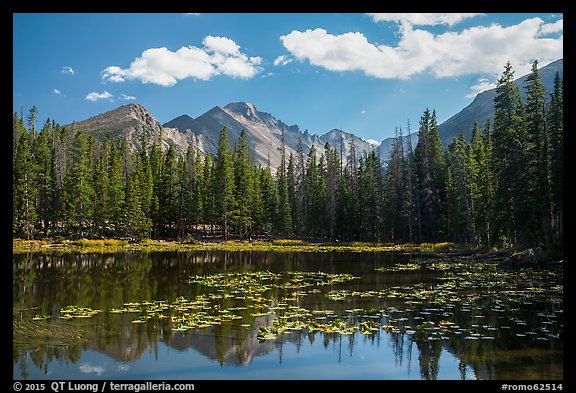
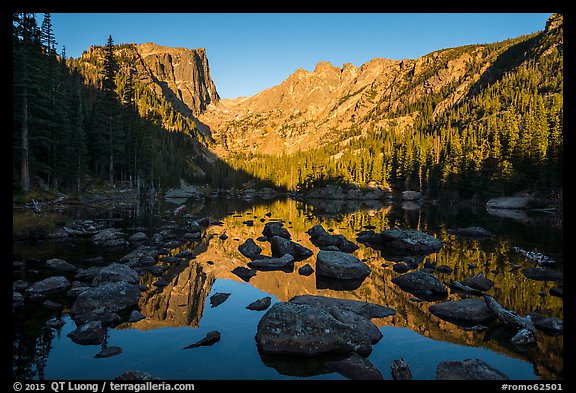
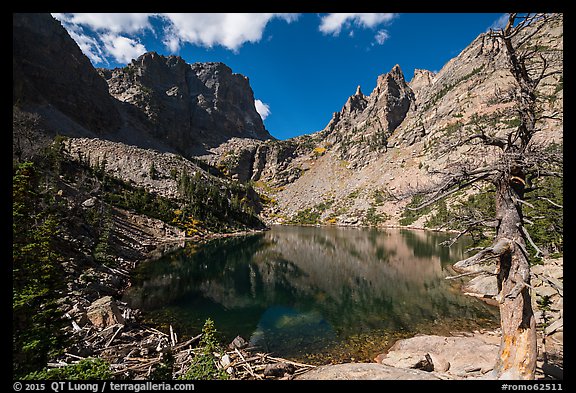
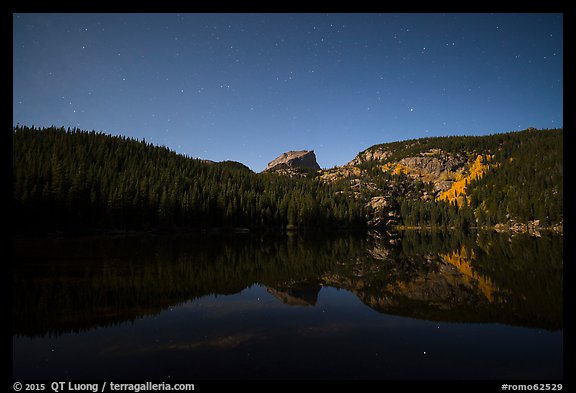
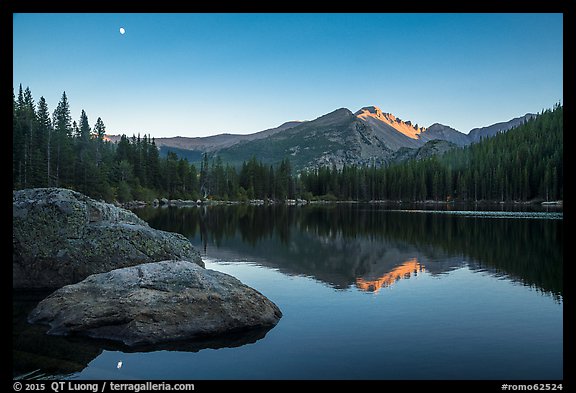
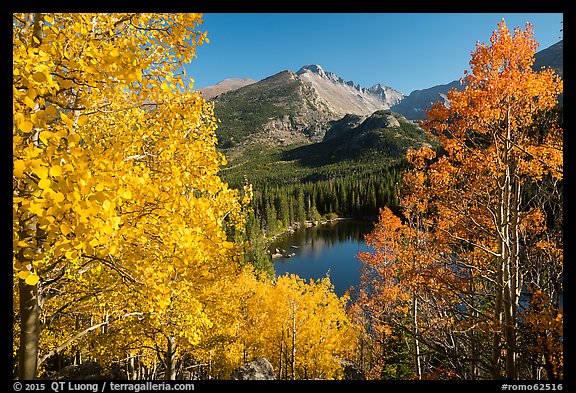
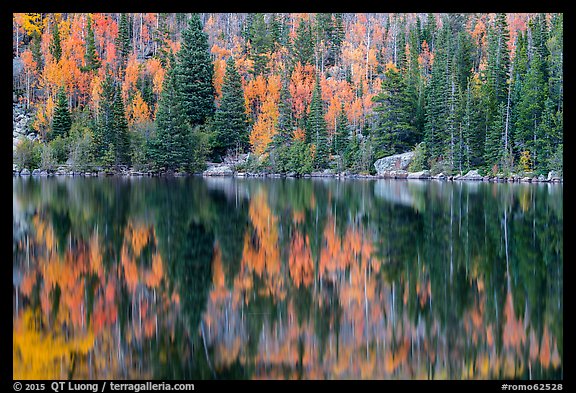
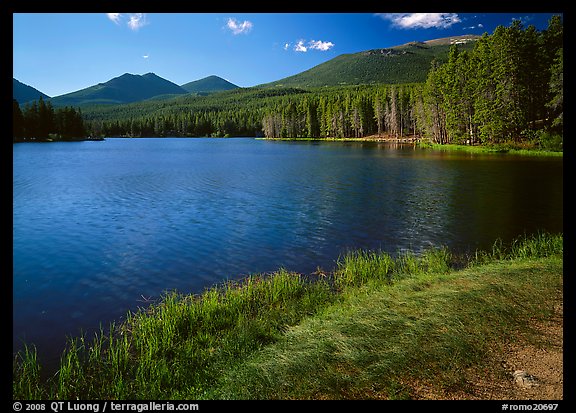
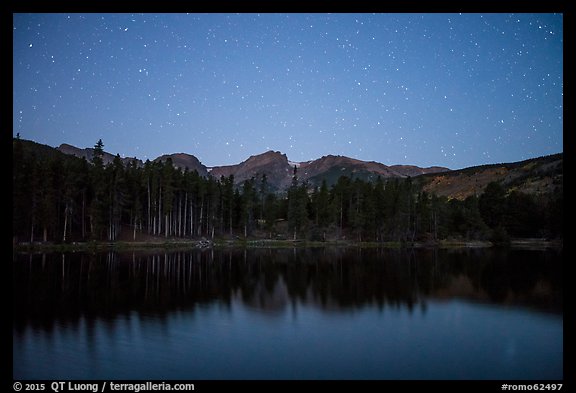
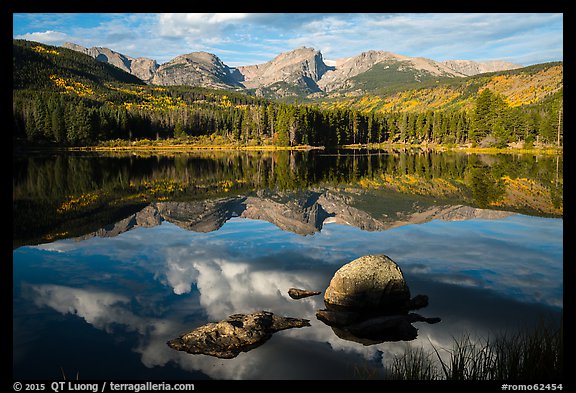
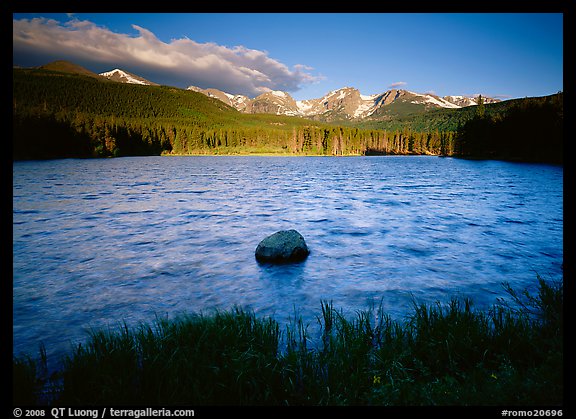
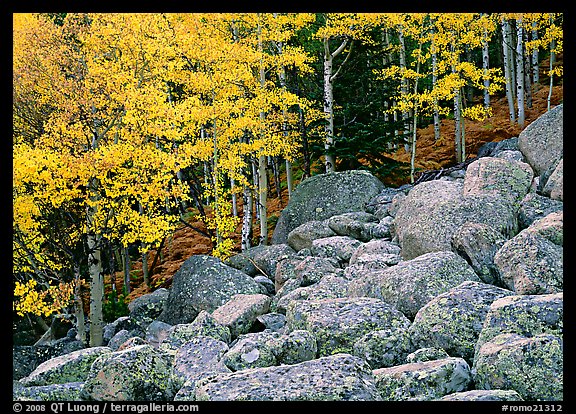
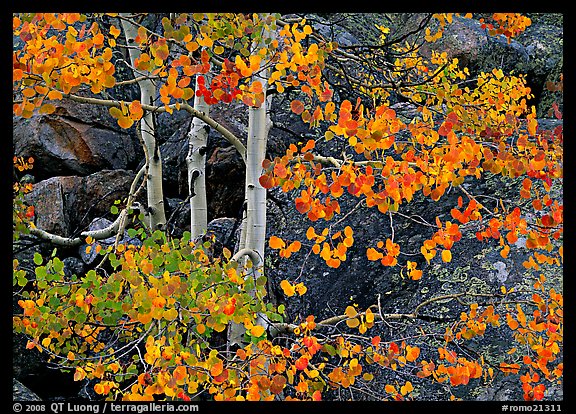
Bear Lake through trees and autumn leaves. Rocky Mountain National Park
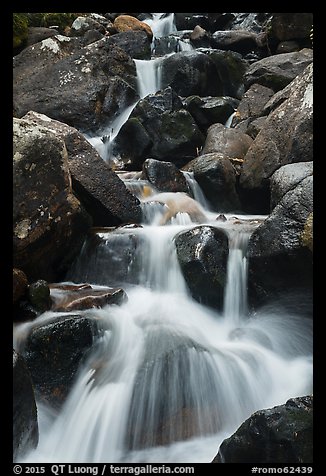
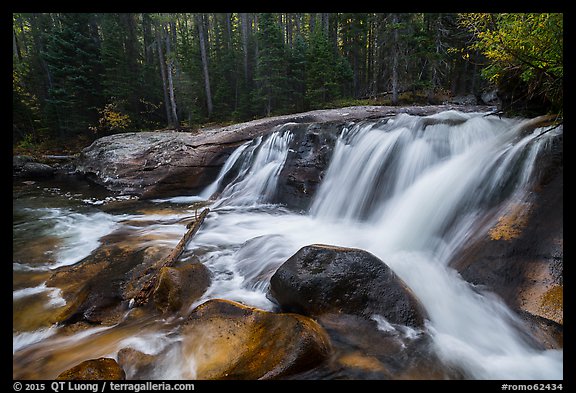
In late September, I revisited Rocky Mountain National Park and photographed lakes and waterfalls.
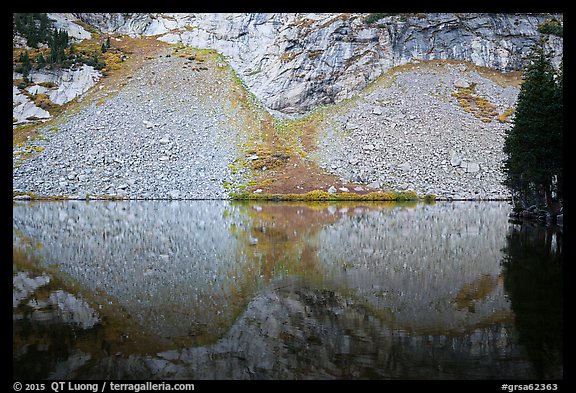
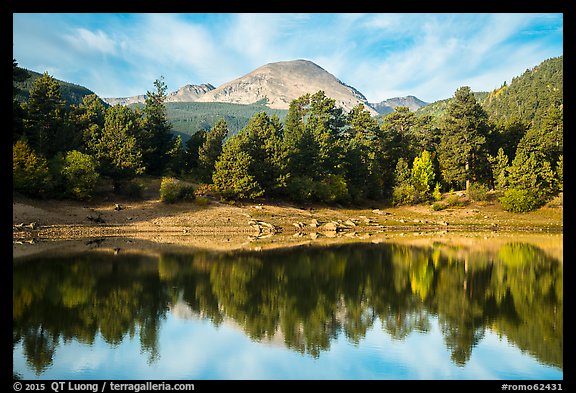
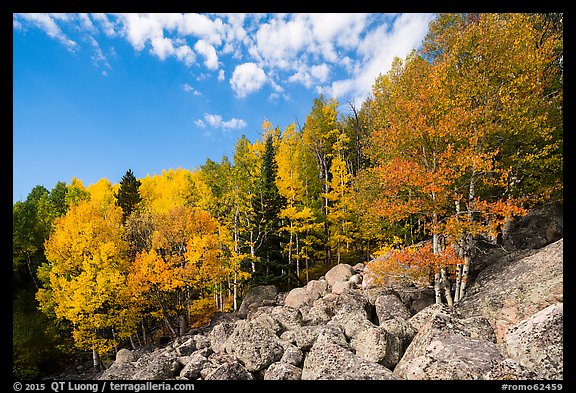
Rock talus reflected in Lower Sand Creek Lake. Great Sand Dunes National Preserve
In Great Sand Dunes National Park and Preserve, my goal was to discover the little visited mountains and views of the Preserve, home to environments unexpected in a park with that name.
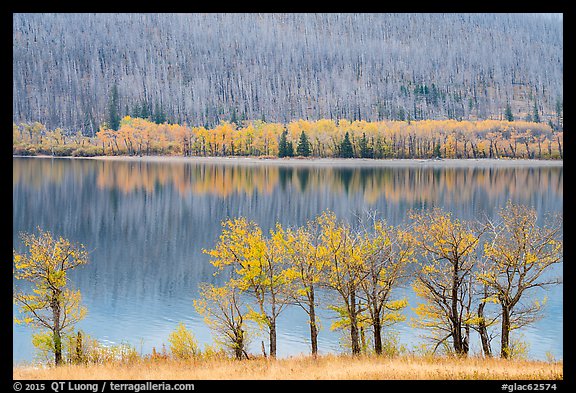
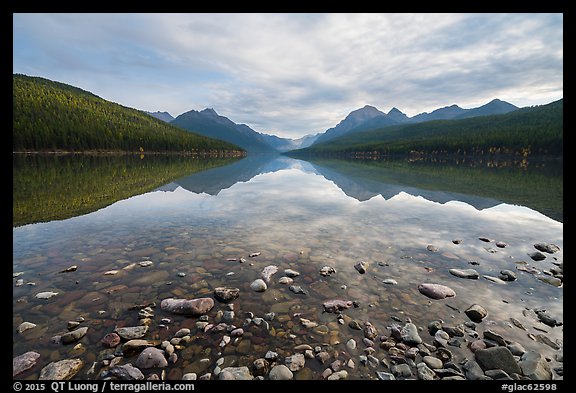
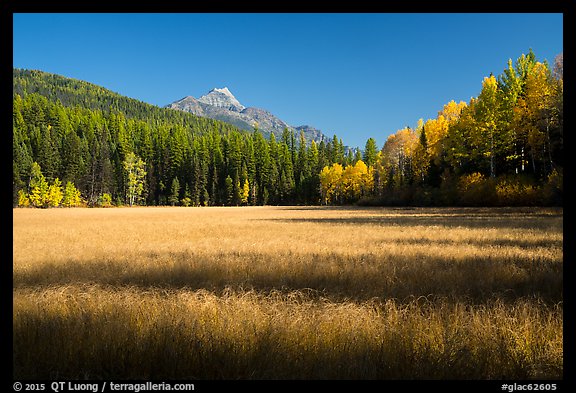
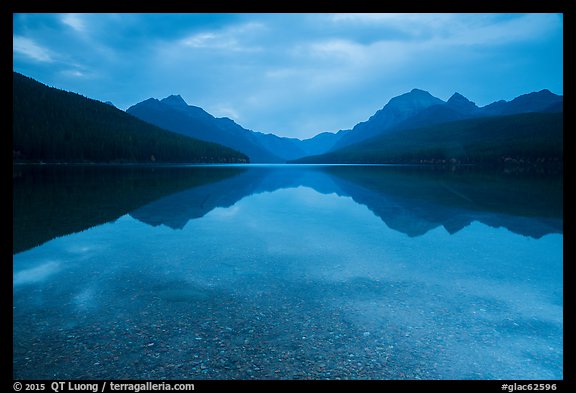
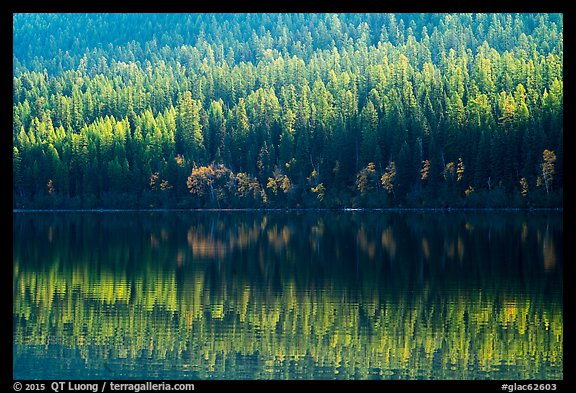
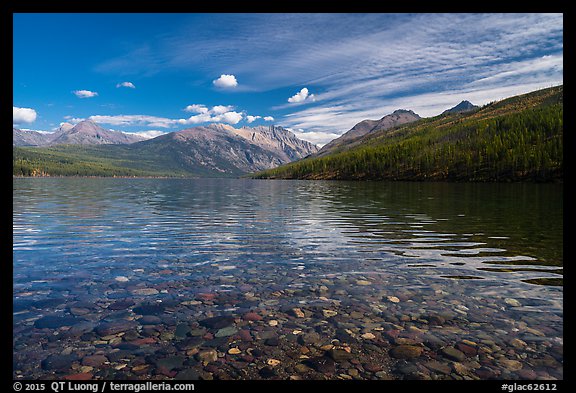
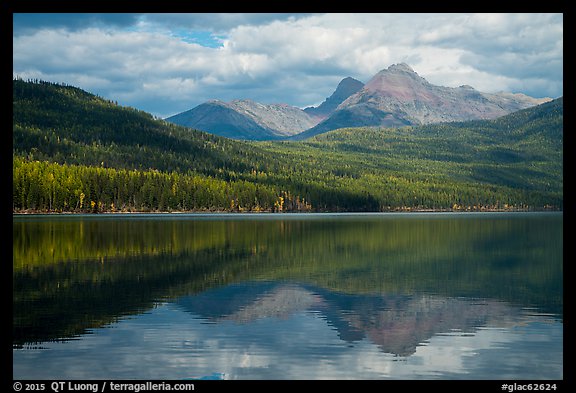
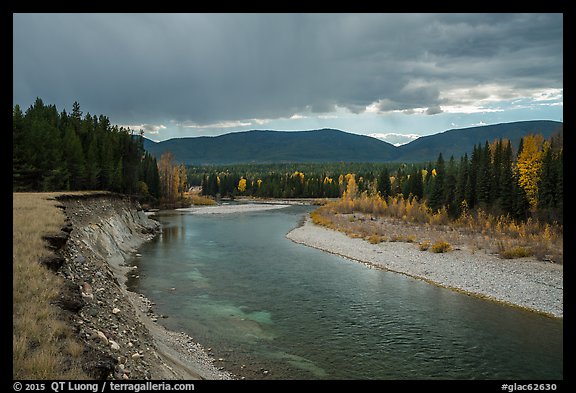
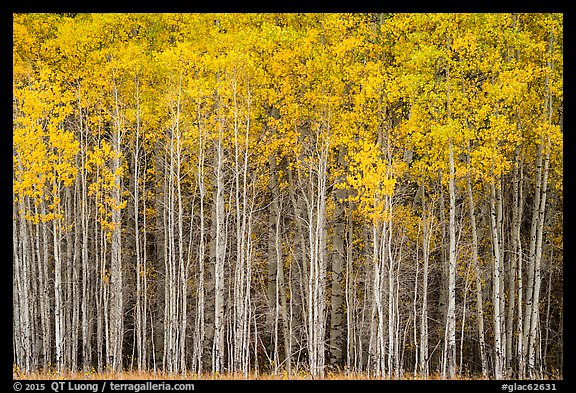
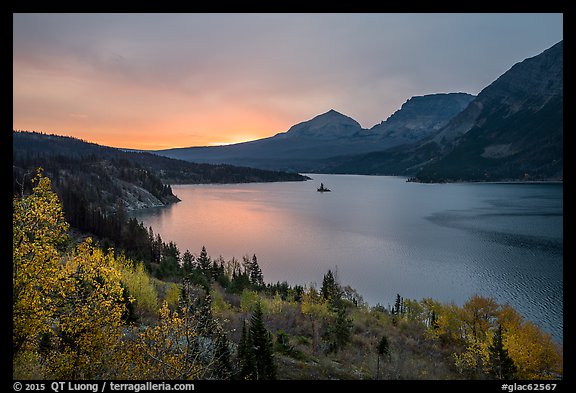
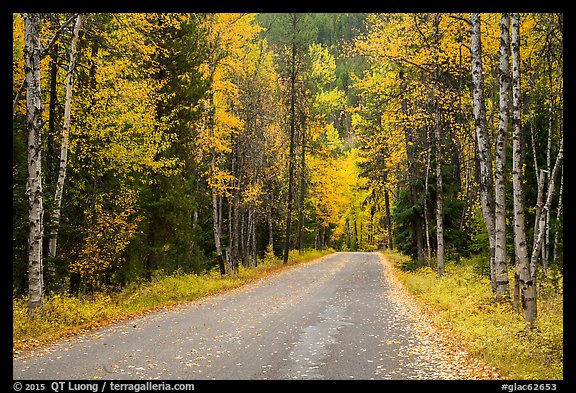
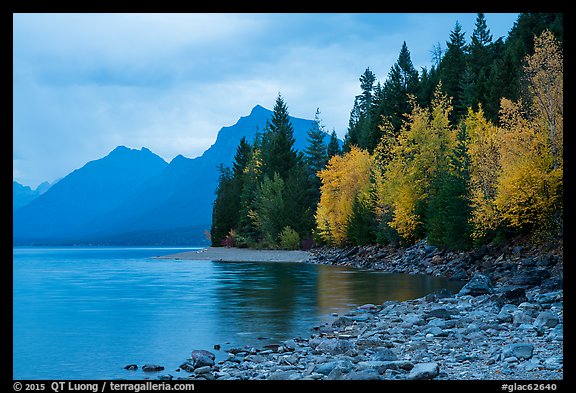
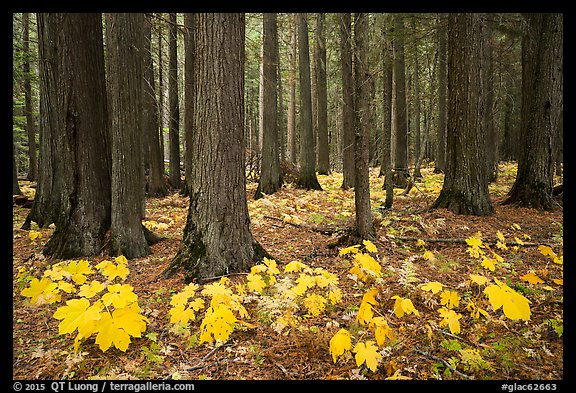
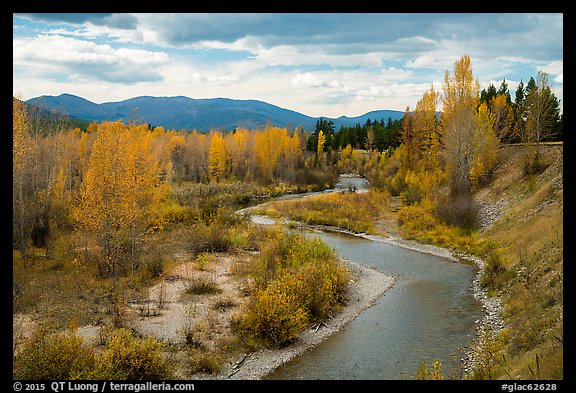
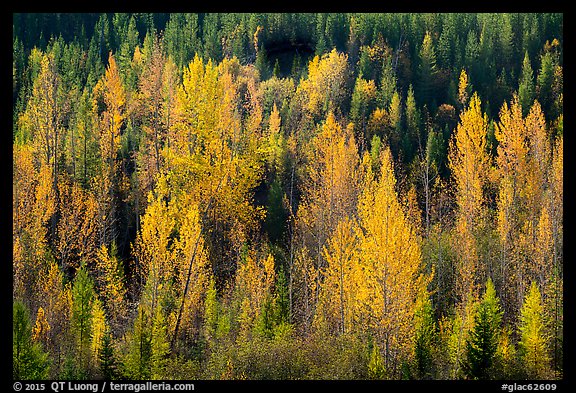
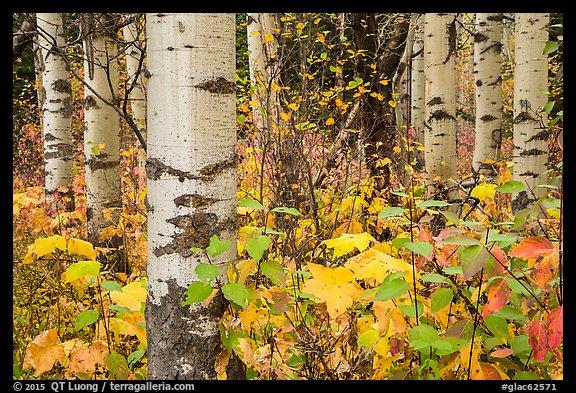
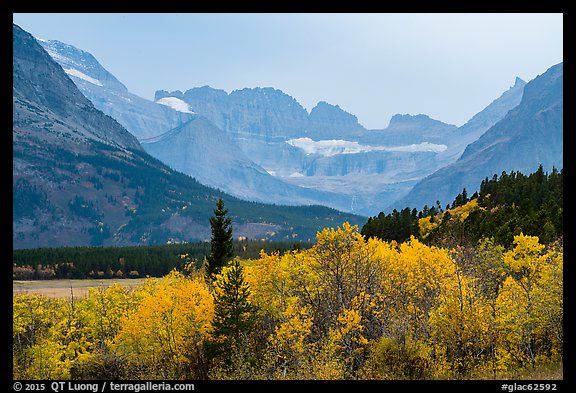
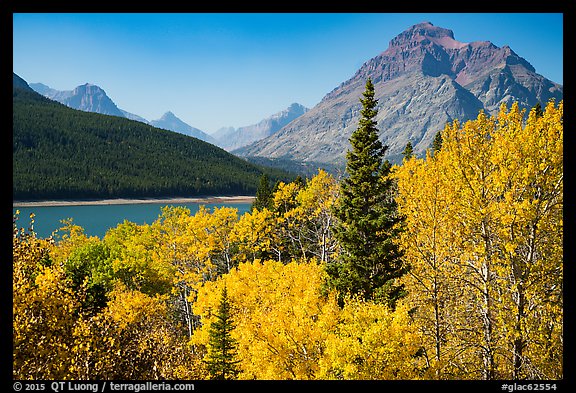
Trees in autumn foliage, burned forest, and reflections, Saint Mary Lake. Glacier National Park
In early October, besides photographing fall color in Glacier National Park, I also drove to the the most remote road-accessible area in the park, highlighted by a pair of very large lakes.
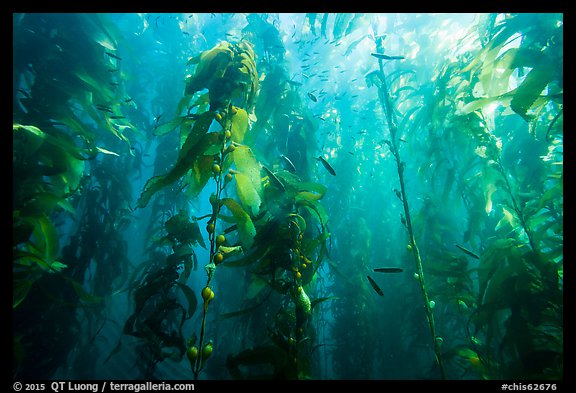
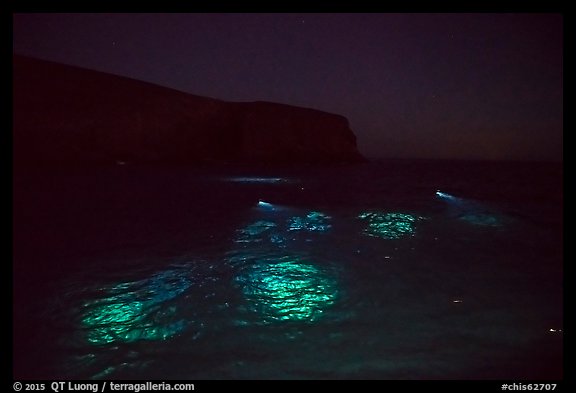
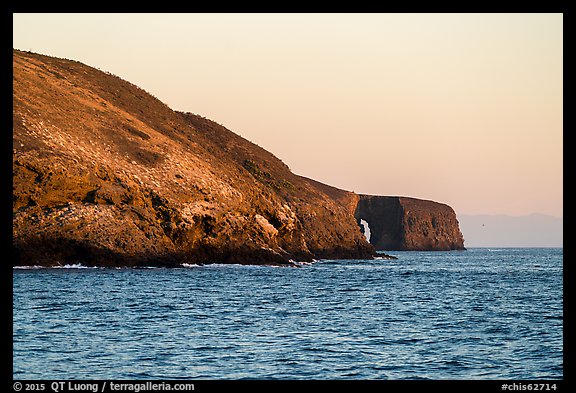
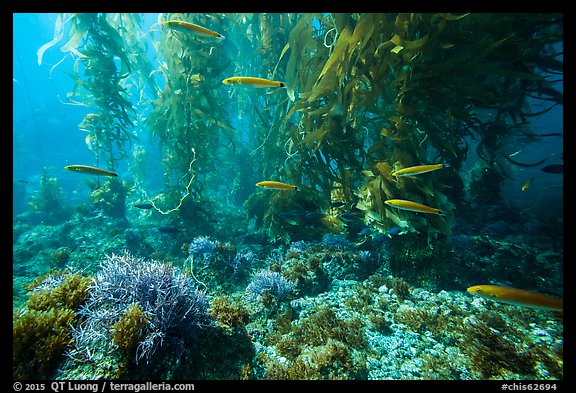
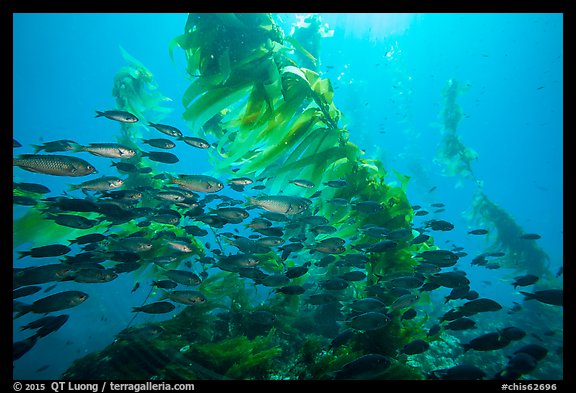
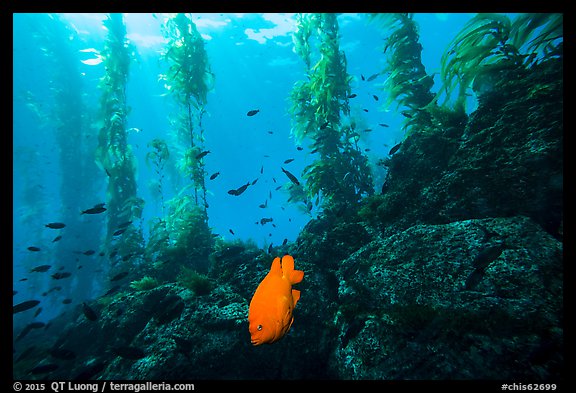
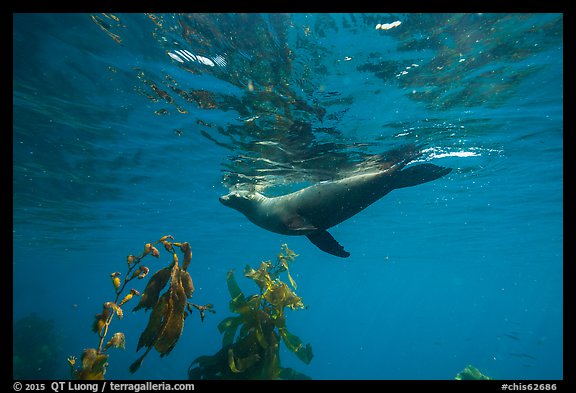
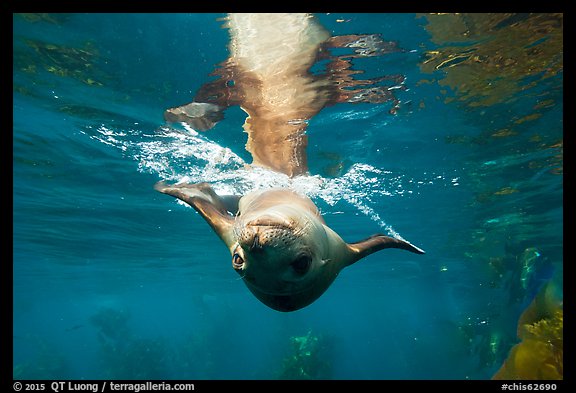
Kelp bed and fish, Santa Barbara Island. Channel Islands National Park
Late October saw the last of my marine trips of this year, when I found at least a satisfying way to photograph Santa Barbara Island, the last of the five Channel Islands that I hadn’t visited.
This represented the last of the national parks “unit” that was still missing. In 2016, I will be moving forward with the publication phase of the national parks project and I hope many of you will like the result.